Learning Objectives
- Distinguish between Endemic, Epidemic, and Pandemic.
- Identify the “Population at Risk” as the critical denominator.
- Analyze Epidemic Curves to identify disease spikes.
- Convert raw cases into Rates using standard multipliers (100,000).
Classification of Disease Presence
| Term | Clinical Pattern | Definition |
|---|---|---|
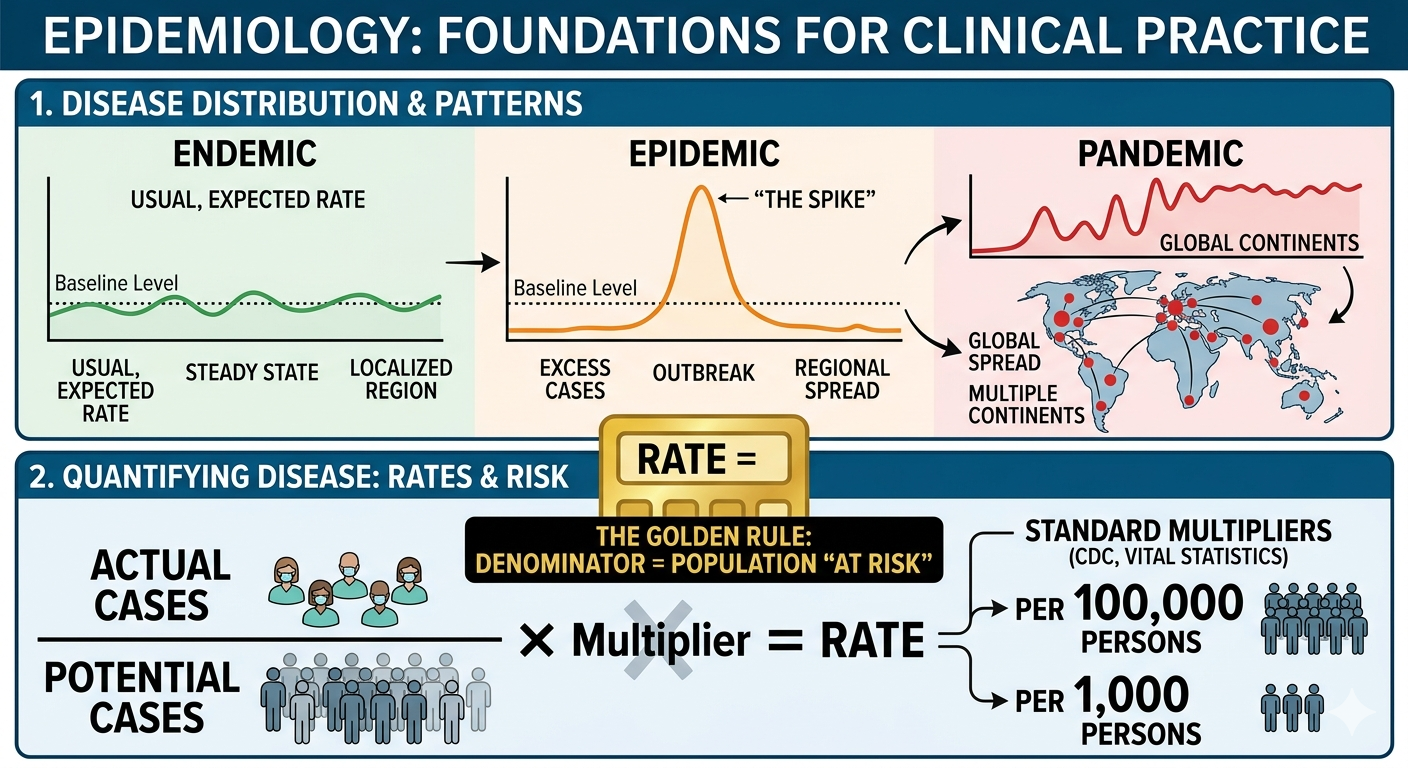
| Endemic | Baseline Level | The usual, expected rate of disease within a region. |
| Epidemic | “The Spike” | Occurrence of disease in excess of the expected rate. |
| Pandemic | Global Spread | An epidemic that has spread worldwide (multiple continents). |
2. Quantifying Disease: The Math of Rates
The Golden Rule: The Denominator is Key. It represents the population “at risk”.
Rate = (Actual Cases / Potential Cases) × Multiplier
- Standard (CDC): 100,000 persons.
- Vital Statistics: 1,000 persons.
3. Case Study: Endemic vs. Epidemic
Plotting cases on an Epidemic Curve (Histogram) allows for rapid visual identification of outbreaks.
| Month | Jan | Feb | Mar | Apr | May |
| Disease 1 (Endemic) | 3 | 4 | 3 | 4 | 4 |
| Disease 2 (Epidemic) | 5 | 5 | 8 | 8 | 5 |
*Cases per 100,000 population. Note the “spike” in Disease 2 during March and April.
IV. Clinical Pearl: The Scale Effect
An event’s status is relative to its Denominator:
- 500 cases in a small village = Epidemic (a huge deviation from the norm).
- 500 cases in a large nation = Endemic (Statistically insignificant change to the national average).
You must be logged in to post a comment.