
Pressure-Volume (PV) Loops
The PV loop represents the dynamic relationship between ventricular pressure and volume throughout a single cardiac cycle. Mastering these shifts is critical for understanding heart failure and valvular disease.
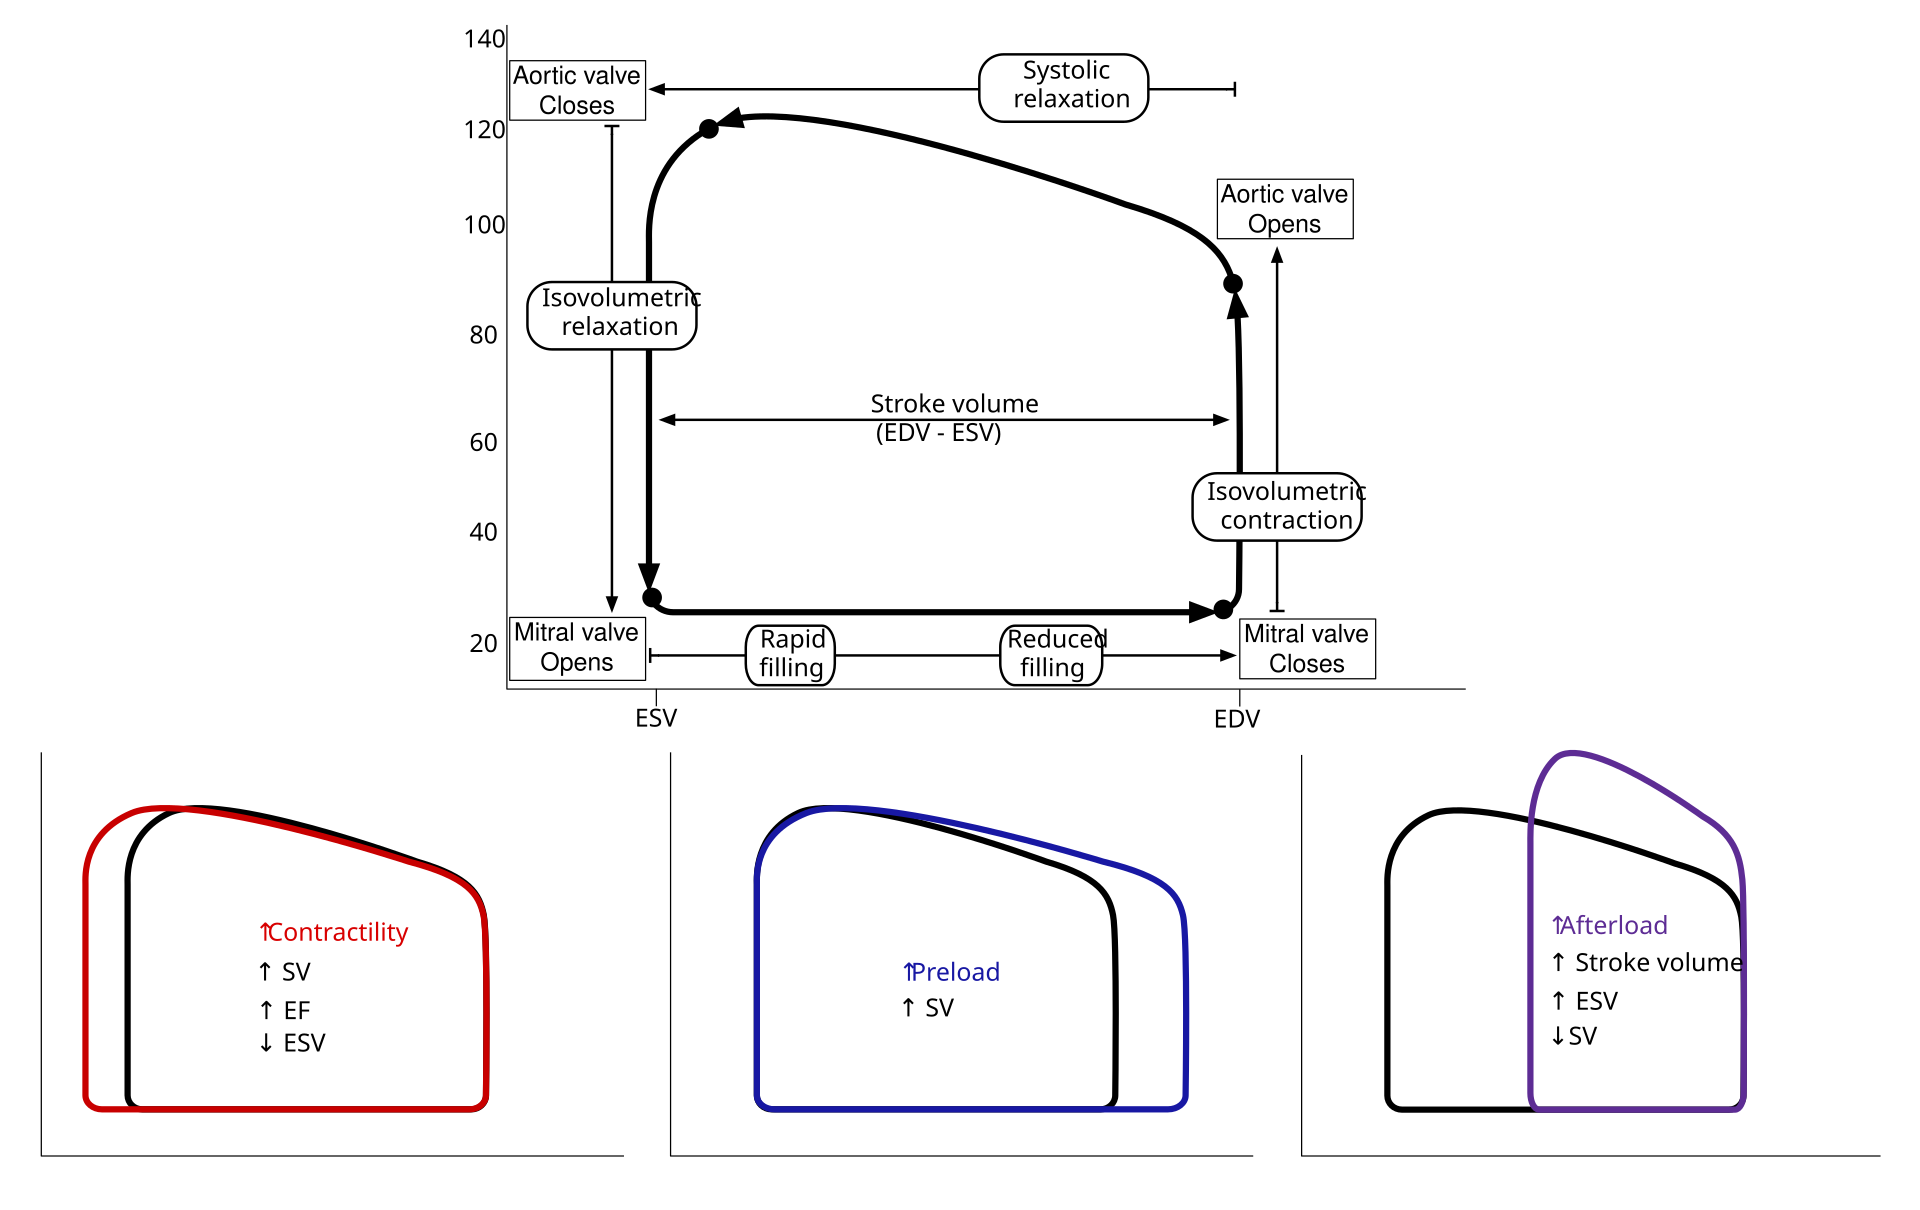
1. The Four Quadrants
| Phase | Key Change |
|---|---|
| Isovolumetric Contraction | Pressure increases, volume stable (Mitral valve closes to Aortic valve opens). |
| Ventricular Ejection | Volume decreases, pressure changes (Aortic valve open). |
| Isovolumetric Relaxation | Pressure decreases, volume stable (Aortic valve closes to Mitral valve opens). |
| Ventricular Filling | Volume increases, pressure stable/low (Mitral valve open). |
2. High-Yield Loop Shifts
- Increased Preload: Shifts the bottom-right corner to the right (increased EDV); width increases (higher SV).
- Increased Afterload: Shifts the top-left corner upward and to the left; width decreases (lower SV).
- Increased Contractility: Top-left corner moves upward and to the left (higher pressure, lower ESV); width increases (higher SV).
Physiology Board Hint: Always visualize the corners. Afterload is represented by the aortic valve opening pressure. Preload is represented by the end-diastolic volume. If the loop gets “taller and thinner,” think of increased afterload (e.g., aortic stenosis). If it gets “wider,” think of increased preload (e.g., exercise or fluid load).
You must be logged in to post a comment.